Your new post is loading...

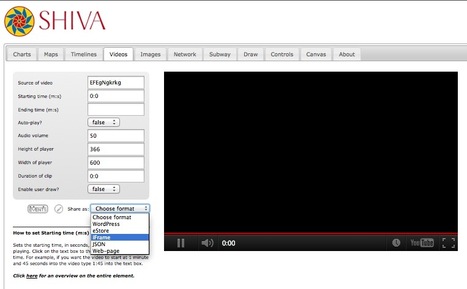

Robin Good: Shanti is a web app which makes it easy to create and generate embedding-code for a number of visual, graphical and data-driven outputs such as video, charts, maps, timelines and more.
In other words, "SHIVA is a web application that provides a simple and consistent interface to open source and open access tools on the web, such as Google's Visualization Toolkit and Maps, YouTube, Vimeo, and Kaltura videos, the SIMILE timeline from MIT, and images from ARTstor, Flickr, and Picasa."
"The data that drives the charts and timelines can come directly from Google Doc's online spreadsheets, facilitating collaboration between multiple contributors. The maps can have any number of overlays, including markers, images, such as historical photos, and online KML GIS files for more involved geographic information."
There is also the option to add an "annotation layer" to any of the embeddable objects generated.
"The annotation layer will enable the creating and sharing of hand-drawn and graphical annotations to be overlayed atop any of the elements, offering new narrative and communication opportunities that support inquiry."
SHIVA was developed at the University of Virginia's Science, Humanities and Arts Network of Technological Initiatives (SHANTI).
Try out SHIVA right now: http://www.viseyes.org/shiva/